
Horizon Dashboard Lab
52 Power BI dashboards for performance staff.
Change the data source, match the column names, and you're looking at your own squad. GPS, testing, wellness, load, injury and match reporting. All of it done.
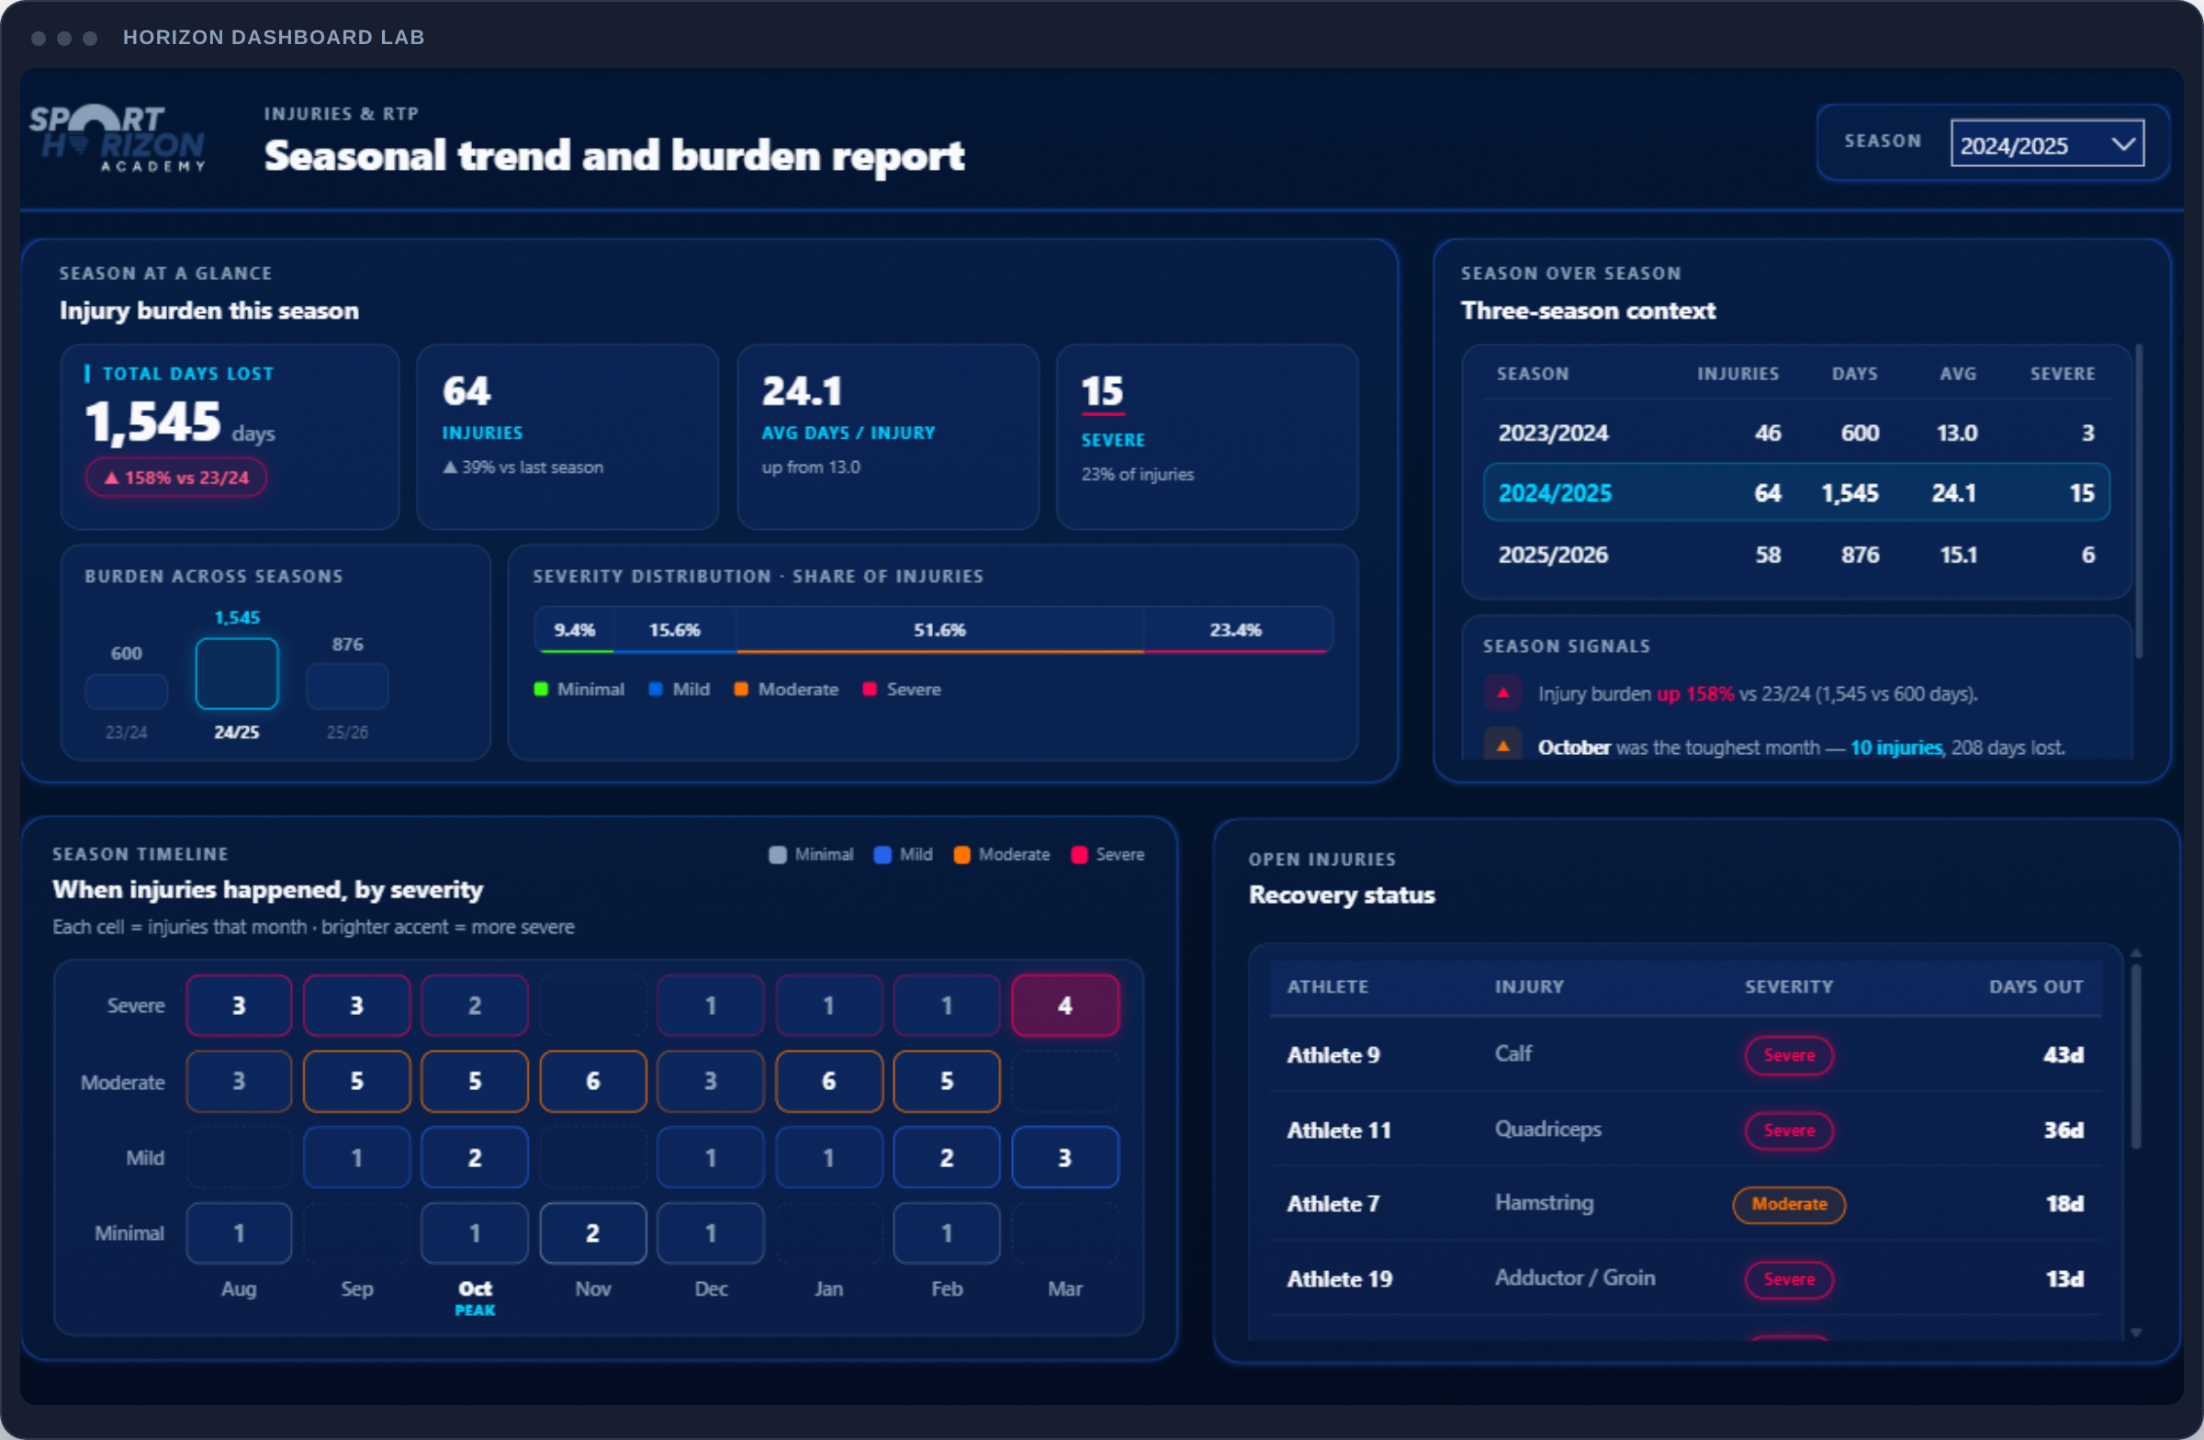
Three steps stand between you and a working report
None of them is building a dashboard — that part is finished.
Open the file
Every dashboard ships as a finished Power BI (.pbix) file. Open it in Power BI Desktop, which is free to download, and it runs immediately on the sample season included.
Point it at your data
Swap the sample data source for yours — your GPS export, force testing sheet, medical log, or a live API connection.
Match the column names
The Column Map lists every field each dashboard expects — match the column names, and the report is instantly running on your squad, not the sample season.
52 dashboards, in 8 collections
Organised the way a performance department is organised, so you can find the one you need on the day you need it.
GPS & movement
Load, speed zones, accel and decel, positional profiles
Performance & force testing
Force plate, jump profiling, strength and speed testing
Wellness, RPE & readiness
Check-in compliance, readiness flags, subjective load
Load monitoring & session planning
Acute to chronic, weekly planning, planned versus actual
Injury, rehab & return to play
Injury location, days lost, recurrence, RTP tracking
Body composition & maturation
Skinfolds, growth curves, maturation status
Tactical & technical
Match events, positional heat maps, scouting
Match & squad reporting
Match day reports, squad availability, season overviews
Everything that's included
52 Power BI dashboards
Finished .pbix files — data model, DAX and layout already built.
The Column Map
Every field each dashboard needs, listed collection by collection.
Custom HTML visuals
Visuals standard Power BI can't build, ready to reuse in your own reports.
Sample datasets
Sample data ships with every dashboard, so you can see it running before you connect your own.
Sport Horizon API access
Included with the library, to connect and build your own workflows against.
Implementation videos
A walkthrough for setting up each dashboard.
Lifetime access
One payment. No subscription, no expiry.
Horizon Dashboard Lab · Inside the library
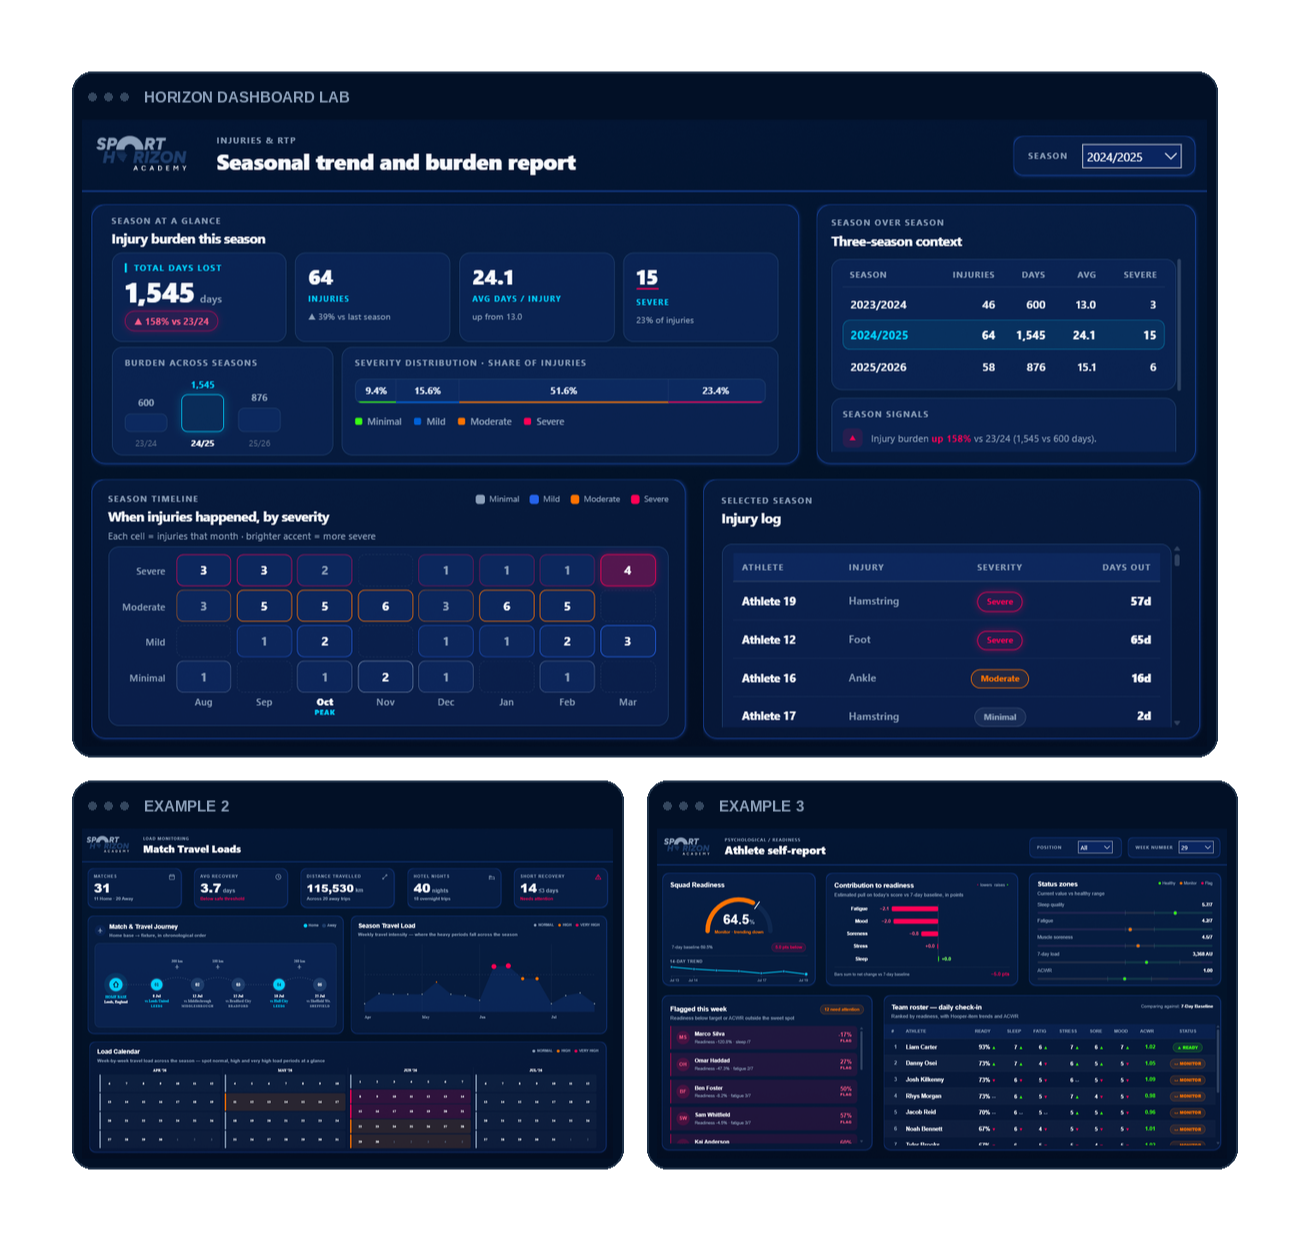
See what's inside.
Every dashboard is a fully functional Power BI report engineered specifically for sport scientists, S&C coaches, and performance analysts.
Built to cover GPS tracking, wellness monitoring, testing protocols, load management, and match reporting — delivering instant clarity so you spend less time processing data and more time driving performance.
One price. Everything included.
One dashboard, built properly, is a day or two of your time. There are 52 in here. Price the hours at whatever your day is worth.
Get the library30 days, no questions, full refund.
Lifetime access.
DAYS
Try it against your own data first
Open the first dashboard and point it at your season. If it doesn't work in your environment, tell us inside 30 days for a full refund. No questions asked.
Is this for you?
This is for you if
- ✓You work in performance, sport science, medical or analysis, at a club, academy, federation or institute.
- ✓You've outgrown spreadsheets and you want reports people act on.
- ✓You're short on hours, not on ideas.
- ✓You want to be the person in the building who owns the data.
This isn't for you if
- ✕You're starting Power BI from zero. Take Power BI for Sport Scientists Level 1 first, then come back.
- ✕You want advanced coding. This is applied performance work, not software engineering.
- ✕You want one short course to finish. This is a library you'll be opening in three years.
Questions
The dashboards are already made and ready to be used. The only change needed is to modify the data source and column names to match your own structure.
The Column Map lists every field each dashboard needs, collection by collection. Check it against your export before you buy, and you'll know whether it works with your data.
No. The Column Map tells you exactly which fields to match, and the three steps — open, point at your data, match the columns — are the whole process.
52 Power BI dashboards, the Column Map, custom HTML visuals, sample datasets, Sport Horizon API access, and implementation videos — all on a lifetime licence.
A computer with Power BI Desktop installed. It's free.
Yes — you can split your payment at checkout.
Yes — contact us with your details and we'll send an invoice with your VAT number on it.