Master Sports Analytics with Our Power BI & Tableau Courses
Become the expert in your organisation — learn to visualise, analyse, and communicate data with confidence.
Trusted by sport scientists and coaches in elite teams worldwide.

Load Monitoring Theory and Application
Learn to track internal and external load, balance training and recovery, and communicate insights clearly through practical dashboards.

Power BI for Sport Scientists – Level 1
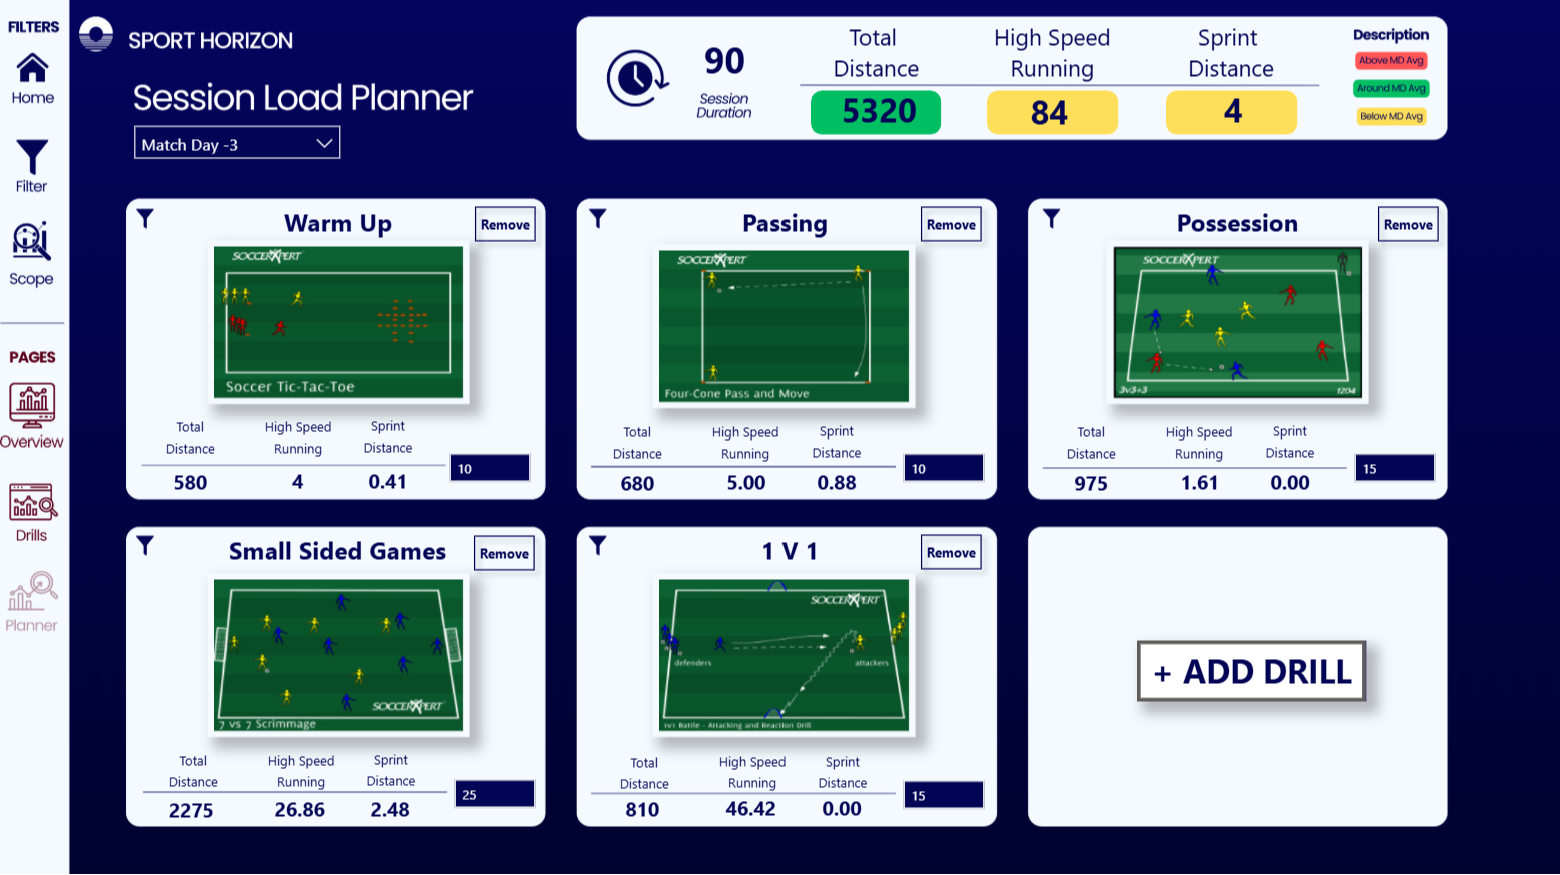
A hands-on course designed to teach you how to turn GPS data into clear, actionable reports — even if you’ve never used Power BI before.
You’ll follow a simple, step-by-step process to clean, model, and visualise your data, learning how to create dashboards that make sense to coaches and performance staff.
-
Build GPS load reports
-
Create automated data cleaning processes
-
Add metrics like % match load and intensity
-
Design benchmarks and match-demand visuals
-
Self-paced, lifetime access
By the end, you’ll confidently build Power BI dashboards that bring your team’s data to life.

Power BI for Sport Practitioners
Learn to connect, automate, model, and visualise athlete data — from GPS to gym load.

Power BI for Sport Scientists – Level 1
A hands-on course designed to teach you how to turn GPS data into clear, actionable reports — even if you’ve never used Power BI before.
You’ll follow a simple, step-by-step process to clean, model, and visualise your data, learning how to create dashboards that make sense to coaches and performance staff.
-
Build GPS load reports
-
Create automated data cleaning processes
-
Add metrics like % match load and intensity
-
Design benchmarks and match-demand visuals
-
Self-paced, lifetime access
By the end, you’ll confidently build Power BI dashboards that bring your team’s data to life.

Power BI for Sport Scientists – Level 2
An advanced Power BI course for sport scientists and practitioners who want to build smarter, more dynamic reports by combining multiple data sources.
You’ll learn advanced DAX, data modelling, and design techniques to take your dashboards to the next level — faster, cleaner, and more automated.
-
Fitness testing, player & match reports
-
Periodisation and benchmarking dashboards
-
Advanced data modelling & relationships
-
130 videos, 13 hours, self-paced
By the end, you’ll create advanced Power BI reports that deliver real insight and professional impact.

Power BI for Strength & Conditioning Coaches – Level 1
The most specific Power BI course designed for S&C coaches in sport — teaching you how to connect, analyse, and visualise athlete data step by step.
You’ll learn how to clean and prepare data, calculate key performance metrics, and build practical S&C reports without needing any coding experience.
-
Gym, jump, and GPS load reports
-
Data modelling and Power Query Editor
-
DAX calculations made simple
-
119 videos, 11 modules, self-paced
By the end, you’ll build your own Power BI reports to track performance and progress with reports that stand out.
Tableau for Sport Practitioners
Learn to connect, model, and visualise athlete data — from GPS to athlete performance data.

Tableau for Sport Scientists – Level 1
Starter pack
Most popular
- 35 step-by-step video guides
- GPS data analysis
- Session, weekly load & benchmarking reports
- Target report
- Data cleaning & modelling
- Access to a private community
Tableau for Sport Scientists – Level 1
A hands-on course designed to teach you how to turn GPS data into clear, actionable reports — even if you’ve never used Tableau before.
You’ll follow a simple, step-by-step process to clean, model, and visualise your data, learning how to create dashboards that make sense to coaches and performance staff.
-
Build GPS load reports
-
Create automated data cleaning processes
-
Add metrics like % match load and intensity
-
Design benchmarks and match-demand visuals
-
Self-paced, lifetime access
By the end, you’ll confidently build Tableau dashboards that bring your team’s data to life.

Tableau for Performance Analysts – Level 1
Starter pack
No experience needed
- 50 step-by-step video guides
- Soccer performance analysis
- Data cleaning & modelling
- Team analysis, comparisons, player performance
- Access to a private community
- Life-time access
Tableau for Performance Analysts – Level 1
A practical, step-by-step course that shows you how to turn match and performance data into clear, interactive Tableau dashboards.
You’ll learn to prepare, calculate, and visualise your data — building reports that give instant insight into team and player performance.
-
Recruitment, match & opposition reports
-
Data cleaning and preparation tools
-
Key calculations & “FIXED” functions
-
Interactive dashboards & metric filters
-
Self-paced with lifetime access
By the end, you’ll build professional Tableau reports that bring your analysis to life.
Why Practitioners Choose Sport Horizon
Our courses are trusted worldwide for their practical design, clear step-by-step teaching, and focus on real performance insights.
🎓 Step-by-Step Lessons
Follow clear, structured modules designed to teach practical, sport-specific applications.
⏱️ Lifetime Access
Learn at your own pace and revisit lessons anytime — your access never expires.
📊 Built for Practitioners
Designed by sport scientists and coaches — focused on real data and practical outcomes.
🌍 Trusted by Elite Teams
Used by professionals in numerous sports, clubs and organisations to optimise workflows.
🧠 No Experience Needed
Perfect for beginners and pros — we guide you from setup to confident implementation.
💬 Community & Team Support
Access private community and our team to support your learning journey.
💸 Money-Back Guarantee
Try any course risk-free. Get a full refund within 14 days if you're not satisfied.
🧾 Certificate of Completion
Receive an official certificate to validate your learning and new data skills.
What Practitioners Say
Trusted by sport scientists and performance staff working in elite teams and academies worldwide.
“Sport Horizon upgraded our data processing and visualisation systems with exceptional support and guidance. Their work has helped us answer key questions around load monitoring and athlete development — we’ve since continued collaborating to upskill our performance staff.”
Mark Maxwell
Lead Sport Scientist
Leicester City Academy

“The Power BI for Sport Scientists course was a game-changer. The tailored content and real-life examples provided a comprehensive understanding of how to harness Power BI for performance tracking and decision-making in high-performance sport.”
Brendan Lazarus
Head of Sport Science
North Melbourne FC

“Can’t recommend this course enough for practitioners wanting to embed Power BI and Tableau into their daily workflow. It’s practical, sport-specific, and has transformed how I produce training load analysis reports.”
Sophie Grimson
Physical Performance Data Scientist
Brighton & Hove Albion


