

"Can’t recommend this course highly enough to any sport science practitioners looking to enhance their data analysis and visualisation skills"
Sophie Grimson (Data Scientist Brigthon & Hove Albion)
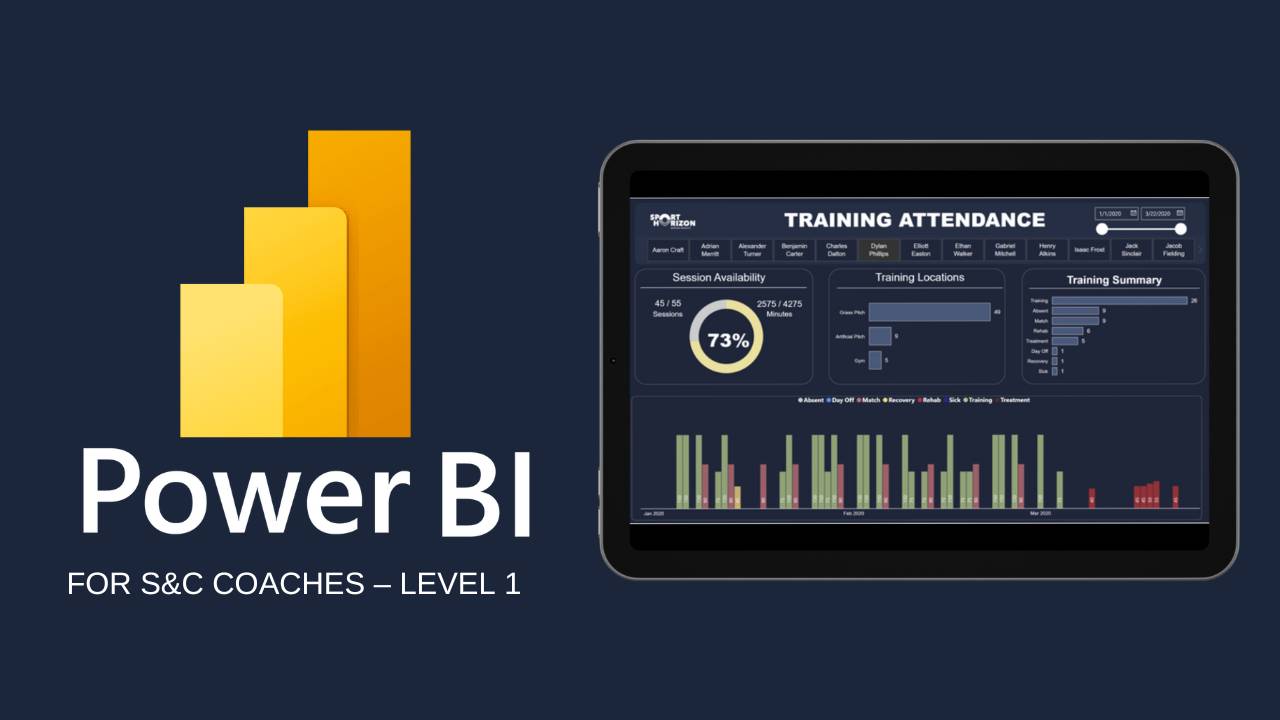
Power BI for S&C Coaches - Level 1
-
Introduction to Power BI for S&C Coaches Level 1
3 lessons- Welcome & Course Overview
- Support and Resources
- The Sport Horizon Platform
-
Module 1 - Introduction to Power BI
9 lessons- Data Download
- Introduction
- 1.1.1 Why Power BI for S&C coaches
- 1.2.1 Downloading Power BI Desktop
- 1.2.2 Power BI Desktop Interface
- 1.3.1 Power BI Mobile and Cloud
- 1.3.2 Power BI Licensing
- 1.4.1 Example reports
- Module 1 Quiz
-
Module 2 - Connecting to Data
8 lessons- Introduction
- 2.1.1 Preparing your raw data file
- 2.2.1 Connecting locally to Excel
- 2.2.2 Connecting to a folder
- 2.2.3 Common mistake when using folder
- 2.3.1 Connection options in Power BI
- 2.4.1 Connecting to SharePoint
- Module 2 Quiz
-
Module 3 - Data Preparation in Power Query Editor
18 lessons- Introduction
- 3.1.1 Power Query Editor walkthrough
- 3.2.1 Removing and modifying columns
- 3.2.2 Filtering data
- 3.2.3 Tips and tricks
- 3.2.4 Date formatting error
- 3.3.1 Split and extract info from column
- 3.3.2 Creating a Session ID
- 3.3.3 Creating a Week ID
- 3.3.4 Conditional column
- 3.3.5 M Language if statement
- 3.3.6 Max speed m/s to km/h
- 3.3.7 Calculating % of max speed
- 3.3.8 Changing time format to duration
- 3.3.9 Creating intensity metrics
- 3.4.1 Basic Group By
- 3.4.2 Advanced Group By
- Module 3 Quiz
-
Module 4 - GPS Session Report Team
19 lessons- Introduction
- 4.1.1 Session and week table
- 4.1.2 Data model theory
- 4.1.3 Relationships
- 4.1.4 Data model practical
- 4.1.5 Data model problem solving
- 4.2.1 Adding a background and logo
- 4.2.2 Adding lines and text boxes
- 4.3.1 Creating a drop-down list
- 4.3.2 DAX theory
- 4.3.3 Columns vs measures calculations
- 4.3.4 Switch function
- 4.4.1 Edit interactions
- 4.4.2 Chart formatting
- 4.4.3 Sorting axis based on tooltip
- 4.4.4 Date filter across tables
- 4.4.5 Team averages
- 4.4.6 Average line
- Module 4 Quiz
-
Module 5 - GPS Load Planner
14 lessons- Introduction
- 5.1.1 Match benchmarking table
- 5.1.2 Considerations for match benchmarking
- 5.2.1 Data modelling
- 5.3.1 Parameters
- 5.3.2 Creating a target
- 5.3.3 Target with conditional formatting
- 5.4.1 Chart building
- 5.4.2 Column formatting tips
- 5.4.3 Merging tables
- 5.4.4 DAX calculation
- 5.4.5 Targets calculation
- 5.4.6 Page selection function
- Module 5 Quiz
-
BONUS: Showcase your work opportunity
1 lesson- Show your work opportunity
-
Module 6 - Training Attendance
11 lessons- Introduction
- 6.1.1 Power Query Editor challenge
- 6.1.2 Challenge solution
- 6.1.3 Column from example
- 6.2.1 Data modelling
- 6.2.2 Filtering (report, page and visual)
- 6.3.1 Report layout
- 6.3.2 Dax calculations
- 6.3.3 Chart developments
- 6.3.4 Final chart edits
- Module 6 Quiz
-
Module 7 - CMJ Team Report
14 lessons- Introduction
- 7.1.1 Data preparation
- 7.2.1 Report setup
- 7.2.2 Drop down menus
- 7.2.3 Ranking based on date
- 7.2.4 Metric selection with switch function
- 7.2.5 DAX: combining switch functions
- 7.2.6 DAX: filtering based on jump height
- 7.2.7 DAX final code
- 7.3.1 Report design part 1
- 7.3.2 Report design part 2
- 7.3.3 Color formatting based on a measure
- 7.3.4 Final report edits
- Module 7 Quiz
-
Module 8 - CMJ Individual Report
14 lessons- Introduction
- 8.1.1 Ranking trials
- 8.1.2 Finding previous performance
- 8.1.3 Allowing blank cell for first trial
- 8.1.4 Percentage change
- 8.2.1 Report setup
- 8.2.2 Bookmarks – show and hide filter
- 8.3.1 Performance line chart
- 8.3.2 Asymmetry bar charts
- 8.3.3 RSI mod - line chart
- 8.3.4 Metric relationships with scatterplots
- 8.3.5 Bookmark layout
- 8.3.6 Filtering and highlighting
- Module 8 Quiz
-
Module 9 - Gym Report
13 lessons- Introduction
- 9.1.1 Data exploration
- 9.1.2 1RM estimation
- 9.1.3 Group sets together
- 9.1.4 Session ID
- 9.2.1. Report setup
- 9.2.2 Summary cards part 1
- 9.2.3 Summary cards part 2
- 9.2.4 Bookmarks on summary cards
- 9.3.1 Chart developments
- 9.3.2 1RM estimation chart
- 9.3.3 Joining the athlete table
- Module 9 Quiz
-
Module 10 - Publishing and Sharing
6 lessons- Introduction
- 10.1.1 Exporting to PDF
- 10.1.2 Publish to Power BI service
- 10.1.3 Refreshing data in Power BI service
- 10.1.4 Features in Power BI service
- Module 10 Quiz
-
Module 11 - Moving Forward
5 lessons- Key takeaways
- Trends
- Next steps
- Thank you!
- Power BI S&C Level 1 - Course Feedback
-
NSCA CEU Points
1 lesson- Register NSCA CEU Points