
Plan smarter, and better training sessions in Power BI
Dynamically analyse and plan your sessions. Build your first interactive session report within 60 minutes.
API & Data Preparation
Connect and structure drill & session data.
DAX & Load Calculations
Build dynamic measures and benchmark limits.
Reports & Session Planners
Build complete workflows coaches can export & use.
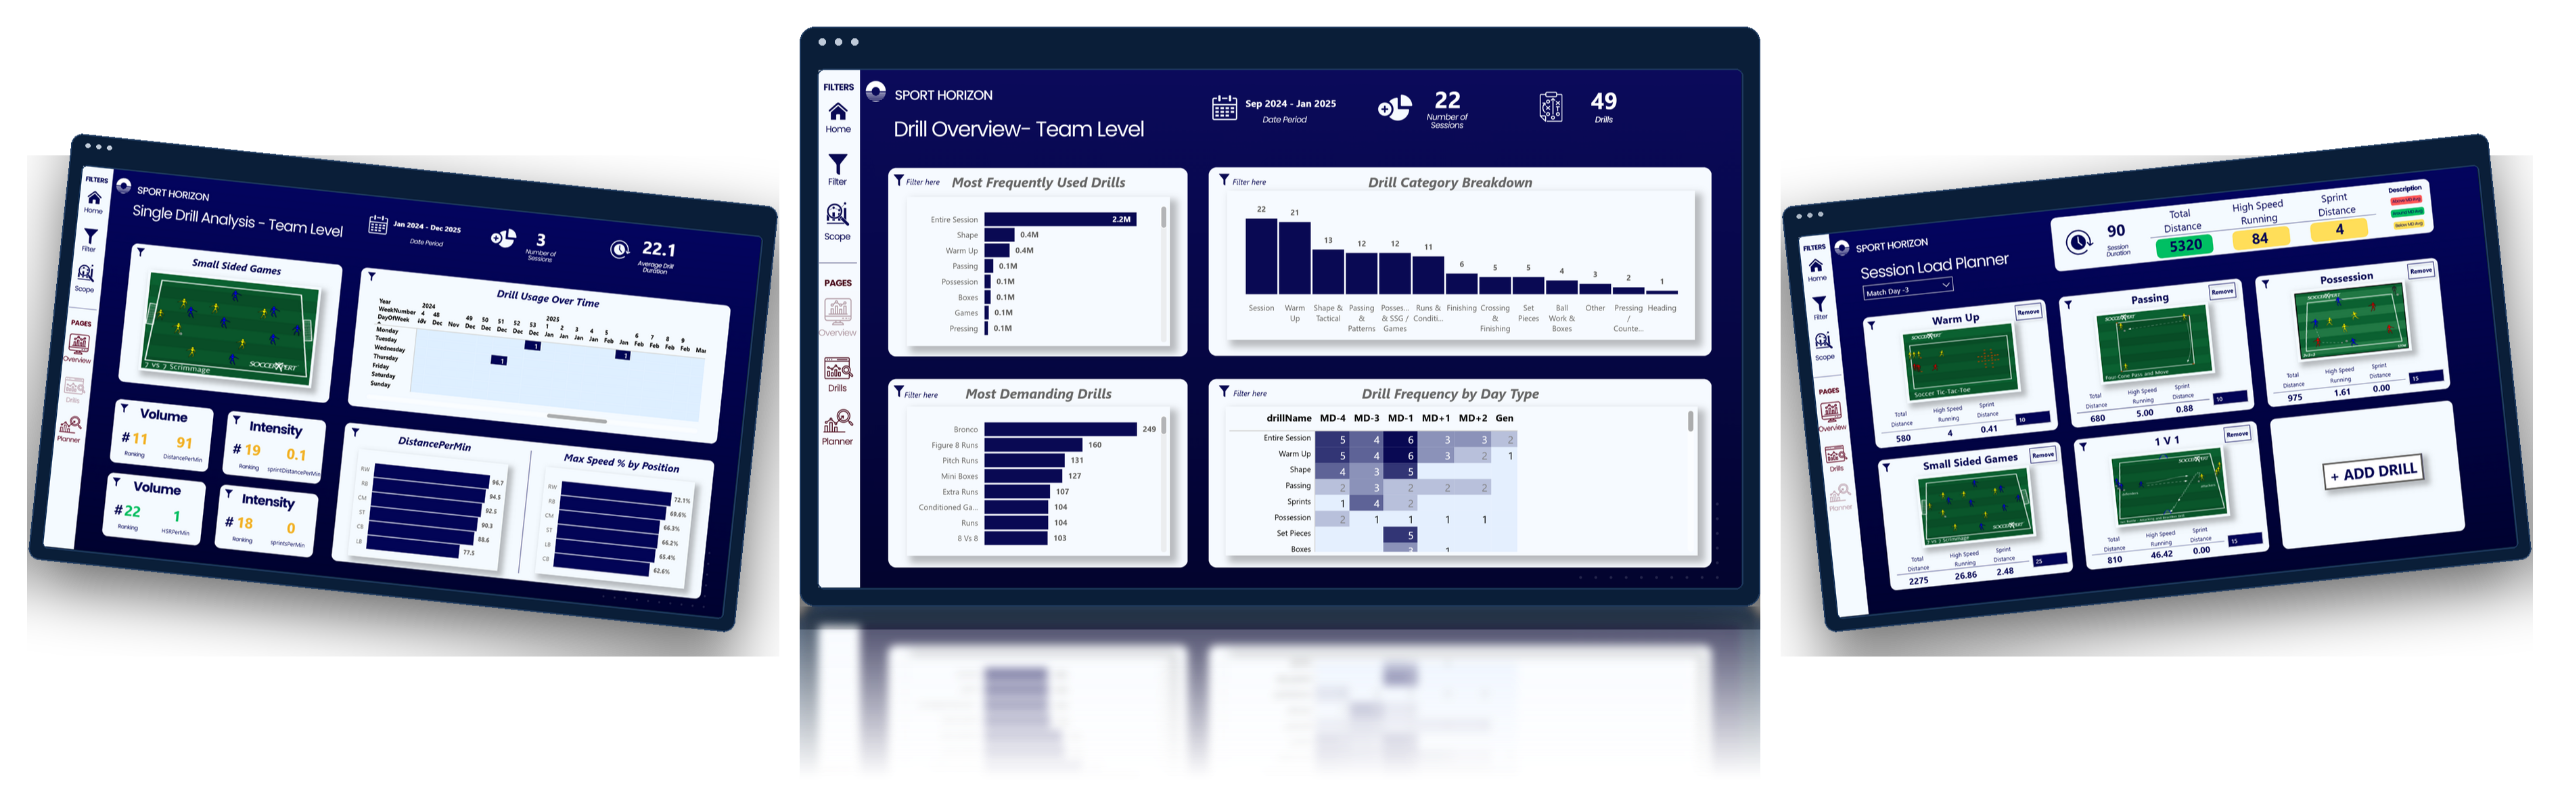
A Glimpse of What You’ll Build
Explore 3 of the dashboards you’ll build in this course with more projects and dashboards waiting for you inside.
Course Modules
Connect to real-time performance APIs, transform drill data, and build an interactive Session Load Planner in Power BI step by step.
- Welcome: Overview of the course structure, expectations, and resources available.
- Support Mechanisms: Accessing community support, help resources, and instructor feedback.
- Platform Navigation: Getting oriented with the Sport Horizon Education platform and downloading course material.
- API Overview: Understanding the Sport Horizon Insights API and performance data structure.
- API Parameters: Setting up and configuring API dynamic parameters in Power BI.
- Advanced Editor Connections: Connecting directly to Athletes, Drills, and Sessions endpoints using M code.
- Table Overview: Reviewing imported data structures and introducing relationship data modeling.
- Formatting Data: Cleaning date fields and formatting additional numerical and text columns.
- Metric Calculations: Creating foundational intensity calculations directly in Power Query.
- Data Transformation: Renaming, filtering, and grouping drill titles for standardisation.
- Data Model Construction: Creating a custom Calendar Table and building robust 1-to-many relationships.
- Design & Layout: Crafting a clean, intuitive team-level drill report wireframe and page navigation.
- Drill Metrics: Visualising most frequently used and most demanding drills using DAX measures.
- Day Type & Categories: Sorting, categorising, and custom-ordering day types and drill categories.
- Dynamic Switching & UX: Implementing dynamic metric switching with DAX, bookmarks, and dynamic headers.
- Showcase Opportunity: Complete the Power BI Challenge and submit your work to the community.
- Layout & Ranking DAX: Designing single drill views and ranking drill intensity dynamically.
- Positional & Speed Analysis: Positional breakdown visuals and calculating percentage of max speed.
- Drill Usage & Formatting: Tracking drill utilization over time with font conditional formatting.
- Visual Media & URLs: Merging drill URL tables and embedding custom drill images/diagrams into reports.
- Planner Architecture: Setting up parameters, table limits, and the main load planner visual canvas.
- DAX Session Measures: Building complex DAX formulas for total session load and total duration.
- Benchmarking Tables: Creating day-type benchmarks and evaluating estimated load vs. benchmark targets.
- Interactive Controls: Designing drill cards, bookmark tips, and drill visibility toggle features.
- Exporting & Sharing: Exporting finished session planning reports to PDF for coaches and players.
- Home Page Hub: Building an executive home navigation page linking all dashboards together.
- Practical Application: Real-world implementation in elite training and pitch side environments.
- Next Steps: Key Power BI takeaways, next steps in learning, and course feedback.










Meet Your Course Tutor
Ciaran Deely (PhD)
Ciaran is a former Director and Co-Founder of Sport Horizon and has extensive experience working as a sport scientist and coach at elite sports organisations such as QPR FC and Kerala Blasters FC.
Having coached and managed the London Gaelic Football team, Ciaran’s scientific rationale and applied coaching knowledge make him the ideal tutor to facilitate learning of session load planning and applied drill analysis outcomes.

Power BI Session Planner — Level 1
- Connect Power BI to the Sport Horizon Insights API
- Dynamic Session Load Planner
- Drill load analysis ranking
- Drill periodisation analysis
- Data modelling & Preparation
- Export and share reports with coaches & athletes
Frequently Asked Questions
This is a step-by-step, self-paced online course, that you can complete in your own time. You can start and finish the course whenever you want.
We are pleased to offer our courses with subtitles in four different languages: English, Spanish, Italian, and French.
You don't need any prior knowledge or experience of Power BI. You can be a beginner, intermediate, or expert level practitioner. As we will take you through a journey from the very beginning of how to clean and manipulate your data, connect it, to the point where you are creating insightful and engaging visualisations.
Power BI software is available free from Microsoft to download at the following link: https://powerbi.microsoft.com/en-us/downloads/
Yes, we offer student discount.
Please fill out the form on https://www.sporthorizon.co.uk/student-discount in order to recieve your discount.
Sure, we can provide an invoice with your VAT number. Just email us at [email protected] with your details, and we'll send you a customized invoice.
Yes, we offer the option to pay for the courses in instalments. You select the payment option you prefer at checkout. If you require further options, please send an email to [email protected]
Yes! We have a private community where you can ask questions, discuss topics, and connect with other students. Additionally, you can reach out to the instructors for guidance and support related to the course material.
Yes! Upon completing the course, you’ll receive an official Sport Horizon Certificate.
You can download and share it on LinkedIn or include it in your professional portfolio to showcase your applied skills.
