
Build 6 real sport dashboards with Power BI
From Excel to Automation
Build automated dashboards that save time, impress coaches, and drive better decisions.
Enroll Now →Power Query Editor
Clean, modify, and prepare your data for high-level analysis.
DAX Calculations
Make specific calculations required for custom performance reports.
Visualisation & Reports
Design and develop intuitive, highly informative reports step by step.
A Glimpse of What You’ll Build
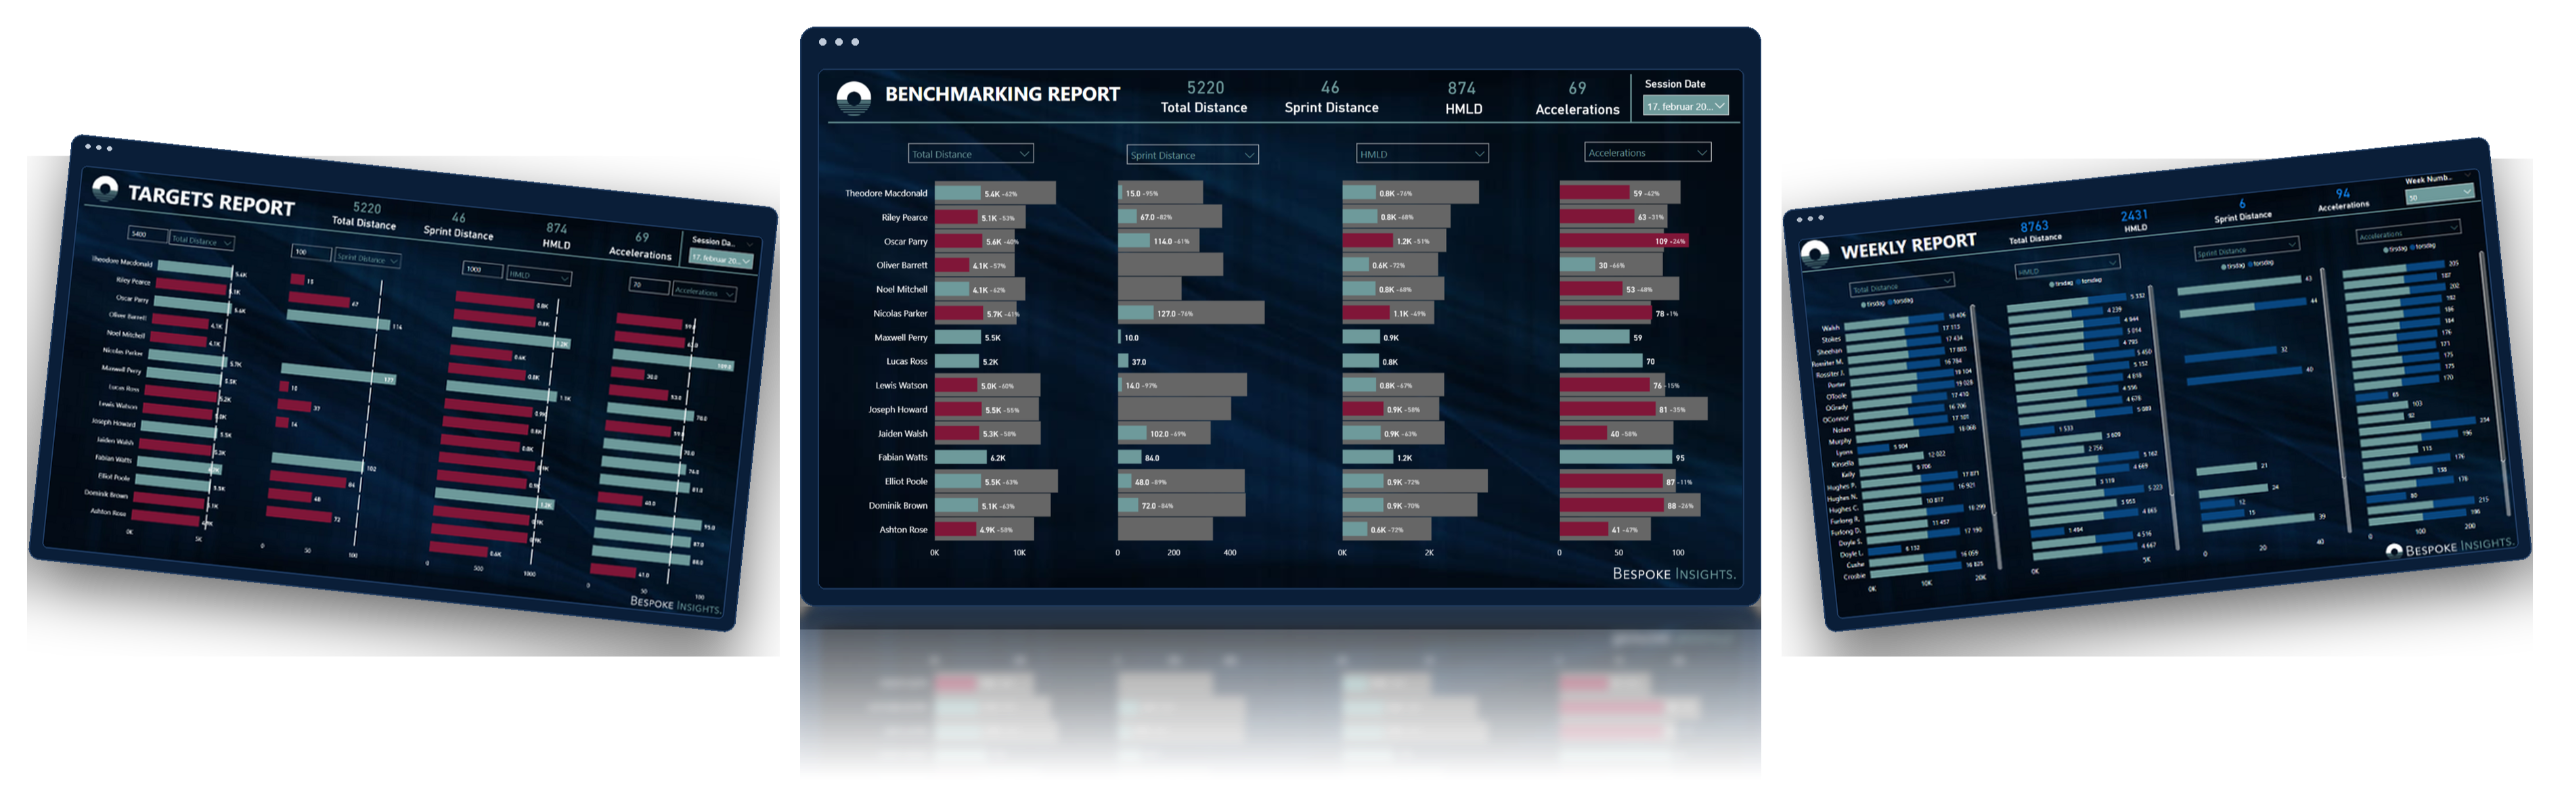
Explore 3 of the dashboards you’ll build in this course with more projects and dashboards waiting for you inside.
Course Modules
Everything you need to go from raw Excel files to fully automated Power BI dashboards, built specifically for sport science and performance environments.
- Welcome from Johannes Marthinussen
- Introduction to the course structure, expectations, and resources available
- Prepare your raw data files for analysis
- Explore cloud vs local data storage options
- Learn how to connect Power BI to SharePoint, OneDrive, Dropbox, and local folders
- Navigate and use Power Query Editor
- View, clean, and structure your datasets for analysis
- Create calculated columns and use key functions like “Group By” to organise your data
Learn how to design and build six full performance reports from scratch using Power BI — each tailored for real-world use in elite sport environments:
- Session Report — Track individual and team load with interactive visuals
- Weekly Report — Monitor trends across training weeks and microcycles
- Benchmarking & Target Report — Compare athletes against standards and targets
- Drill Analysis — Break down performance by drill type and load zones
- Game Analysis — Use scatterplots to visualise match data and comparisons
- Dashboard Formatting — Apply professional layout, interactions, and filtering logic
- Export your reports to PDF or PowerPoint for meetings
- Learn how to publish to Power BI Service for online sharing
- Automate data refreshes to keep your dashboards up to date
- Recap key concepts and apply tips for real-world use
- Get guidance on your next learning steps
- Final reflections and wrap-up from the tutor










Meet Your Course Tutor
Johannes Marthinussen (MSc, CSCS)
Johannes is the Director and Founder of Sport Horizon and an experienced performance and analytics professional. His career spans roles at UEFA, the Norwegian Football Federation and League Association, Everton FC, Aspire Academy, and Burnley FC.
With a background in applied sport science, performance and data analysis, Johannes has consulted with clubs and organisations across Europe — helping them turn complex performance data into clear, actionable insight. Through Sport Horizon, he now delivers practical, sport-specific training in Power BI and Tableau for coaches, analysts, and sport scientists.

Power BI for Sport Scientists — Level 1
- Connecting to data
- Data modelling
- Manipulating your data
- Visualising your data
- Session report, weekly load, game demands, benchmark
- Publishing & sharing
Frequently Asked Questions
This is a step-by-step, self-paced online course, that you can complete in your own time. You can start and finish the course whenever you want.
We are pleased to offer our courses with subtitles in four different languages: English, Spanish, Italian, and French.
You don't need any prior knowledge or experience of Power BI. You can be a beginner, intermediate, or expert level practitioner. As we will take you through a journey from the very beginning of how to clean and manipulate your data, connect it, to the point where you are creating insightful and engaging visualisations.
Power BI software is available free from Microsoft to download at the following link: https://powerbi.microsoft.com/en-us/downloads/
Yes, we offer student discount.
Please fill out the form on https://www.sporthorizon.co.uk/student-discount in order to recieve your discount.
Sure, we can provide an invoice with your VAT number. Just email us at [email protected] with your details, and we'll send you a customized invoice.
Yes, we offer the option to pay for the courses in instalments. You select the payment option you prefer at checkout. If you require further options, please send an email to [email protected]
Yes! We have a private community where you can ask questions, discuss topics, and connect with other students. Additionally, you can reach out to the instructors for guidance and support related to the course material.
Yes! Upon completing the course, you’ll receive an official Sport Horizon Certificate.
You can download and share it on LinkedIn or include it in your professional portfolio to showcase your applied skills.