
Build advanced dashboards in Power BI
No coding needed
Take your analysis to the next level with automated dashboards for fitness testing, player benchmarking, and match reporting.
Data Modelling
Build a clean, efficient data model that forms the backbone of every great Power BI report.
Calculations (DAX)
DAX made simple, practical, and directly relevant to sport science metrics.
Visualisation & Reports
Design interactive dashboards that turn complex data into clear, actionable insights.
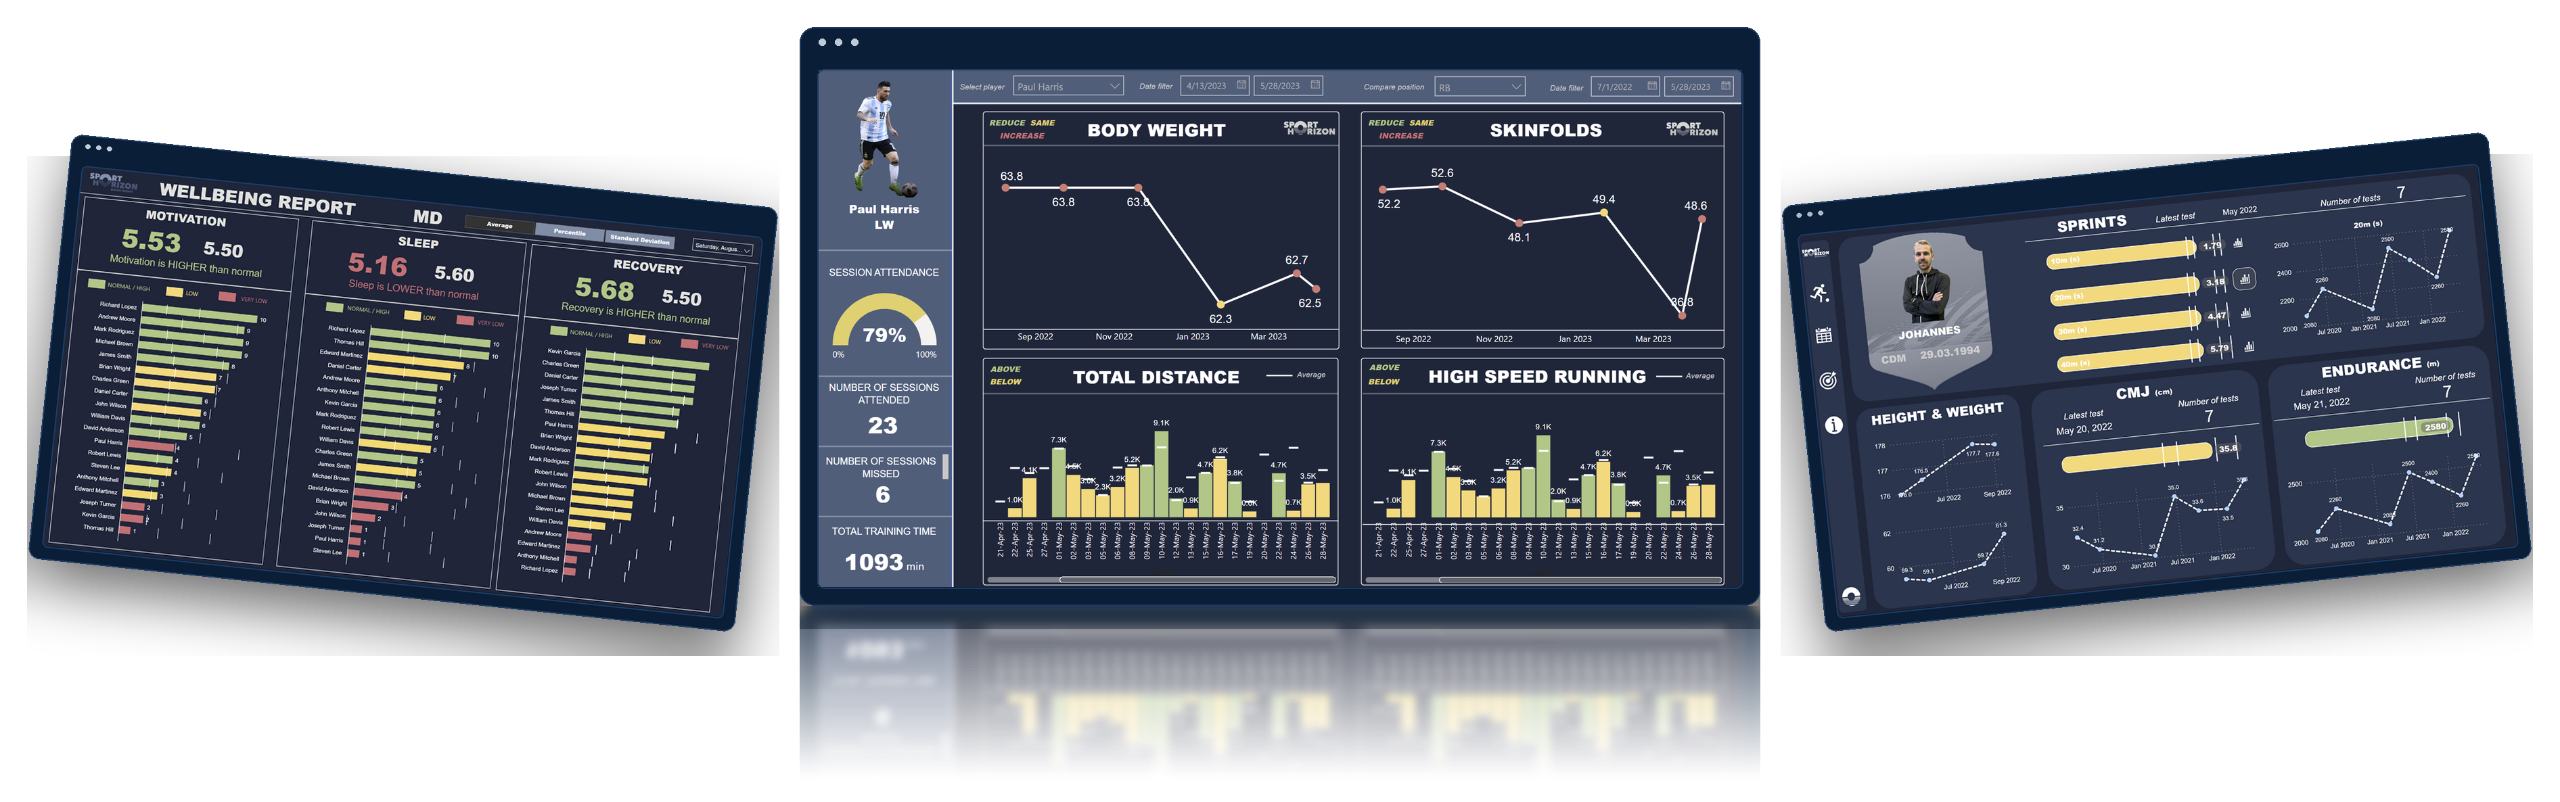
A Glimpse of What You’ll Build
Explore 3 of the dashboards you’ll build in this course with more projects and dashboards waiting for you inside.
Course Modules
Master advanced data modeling, complex DAX formulas, and elite interactive reporting systems built specifically for sports performance environments.
- Welcome & Course Overview: What Level 2 covers, how to navigate the lessons, and expected outcomes.
- Support & Resources: Where to get help, download training data, and access templates.
- The Sport Horizon Platform: How SH Insights fits your workflow and prepares you for future automation.
- Advanced Formatting: Color management best practices and creating a reusable custom theme.
- Club Branding: Build a club theme with custom fonts; apply consistently across reports.
- Parameters & Templates: Create parameter lists; filter by parameter; export/import templates.
- Pro Tips & Extras: Advanced reporting features and shortcuts to speed up build time.
- Quiz: Check your grasp of themes, parameters, and advanced UI tools.
- DAX vs. M: When to use each; practical intro for analysis pipelines.
- M for Prep: Clean, transform, and structure cycle data for robust models.
- Core DAX Blocks: Practical builds + theory for measures you’ll reuse everywhere.
- Visual Builds: Conditional bar charts, counting cycles, totals, and distinct counts.
- Bonus: Extra report-building tricks for faster iteration.
- Quiz: Validate your cycle metrics and visual logic.
- Power Query Mastery: Append, merge, duplicate, reference; choosing the right join types.
- Ranking Logic: RANKX theory to practice for team and player tables.
- Model & Charts: Prepare data model; build rankings; craft clear match visuals.
- Tooltips that Inform: Traditional vs. report-page tooltips; when each is best.
- Dynamic Media: Add dynamic images, home/away logos, and polish with the format brush.
- Final Pass: Sorting, tooltips, and finishing touches for a pro match report.
- Quiz: Confirm your end-to-end match-report pipeline.
- Dates-in-Period: Theory and practical build for rolling windows.
- Metric Switching: SWITCH patterns + field parameters for flexible analysis.
- Report Build (3 parts): Assemble A:C visuals, interactions, and controls.
- UX Details: Use logos as navigation buttons; refine multi-page flows.
- Quiz: Test your command of windows, switching, and A:C design.
- Schemas Explained: Star vs. snowflake—choose the right model for speed and clarity.
- IDs in M: Create robust player IDs and link tables cleanly.
- Stats Toolkit: Averages, SDs, percentiles—with filters that actually respect context.
- Dynamic Switching: Toggle metric and calculation methods seamlessly.
- Navigation & Drill: Bookmarks (reset, show/hide), drilldown, and drillthrough buttons.
- Player & Team Builds: Step-by-step chart construction (player focus, then team view).
- Quiz: Prove you can model wellbeing data and ship usable reports.
- Relationships & Cardinality: Theory + practicals to avoid filter traps.
- Model Construction: Multi-part build of a scalable player-centric model.
- DAX for Monitoring: Weight change, % change, player averages, session attendance, color logic.
- Report Build: Attendance, “missing sessions,” trend charts, and final UI polish.
- Quiz: Validate your player dashboard end-to-end.
- Model Setup: Build comparison and date-aware testing tables.
- Latest Values: Measures for latest score/date; apply across tables.
- Percentiles & Validation: Create fair comparisons and verify outputs.
- Design System: Chart design, sprinting views, and button-based chart selection.
- Bonus: PowerPoint icons for consistent visual language.
- Quiz: Check your fitness testing logic and visuals.
- Model Foundations: Player IDs, average game table, and week-aware date table.
- Comparison Tables: Structure for meaningful period comparisons.
- DAX for Planning: Sort day types, % of game load, dynamic metric selectors.
- Report Craft: Design elements, chart development, and interaction rules.
- Quiz: Confirm your periodisation pipeline from data to decision.
- Key Takeaways: The patterns and templates you’ll reuse in any report.
- Trends: How to spot and present trends credibly to staff.
- Next Steps: Publishing, sharing, and where to go deeper in SH Academy.
- Thank You & Feedback: Close-out and course feedback for continuous improvement.










Meet Your Course Tutor
Johannes Marthinussen (MSc, CSCS)
Johannes is the Director and Founder of Sport Horizon and an experienced performance and analytics professional. His career spans roles at UEFA, the Norwegian Football Federation and League Association, Everton FC, Aspire Academy, and Burnley FC.
With a background in applied sport science, performance and data analysis, Johannes has consulted with clubs and organisations across Europe — helping them turn complex performance data into clear, actionable insight. Through Sport Horizon, he now delivers practical, sport-specific training in Power BI and Tableau for coaches, analysts, and sport scientists.

Power BI for Sport Scientists — Level 2
- 130 videos
- 13 hours of content
- Training data included
- Visualising your data
- Advanced data modelling
- Working with multiple data sources
- Advanced Power Query editor
- Advanced DAX
- Advanced reporting
Frequently Asked Questions
This is a step-by-step, self-paced online course, that you can complete in your own time. You can start and finish the course whenever you want.
We currently offer subtitles in four different languages: English, Spanish, Italian, and French. If you miss any other languages, please reach out to [email protected]
You don't need any prior knowledge or experience of Power BI. You can be a beginner, intermediate, or expert level practitioner. As we will take you through a journey from the very beginning of how to clean and manipulate your data, connect it, to the point where you are creating insightful and engaging visualisations.
Power BI software is available free from Microsoft to download at the following link: https://powerbi.microsoft.com/en-us/downloads/
Yes, we offer student discount.
Please fill out the form on https://www.sporthorizon.co.uk/student-discount in order to recieve your discount.
Sure, we can provide an invoice with your VAT number. Just email us at [email protected] with your details, and we'll send you a customized invoice.
Yes, we offer the option to pay for the courses in instalments. You select the payment option you prefer at checkout. If you require further options, please send an email to [email protected]
Yes! We have a private community where you can ask questions, discuss topics, and connect with other students. Additionally, you can reach out to the instructors for guidance and support related to the course material.
Yes! Upon completing the course, you’ll receive an official Sport Horizon Certificate.
You can download and share it on LinkedIn or include it in your professional portfolio to showcase your applied skills.